What's the long-term prognosis and should you be concerned?
The U.S. Housing Market
 The 2014 housing market is going through a complex and contradictory transitional phase as it recovers from the biggest cataclysm to hit the sector since at least the Great Depression. The growth surge of 2013, which was driven by pent-up demand, has given way to a market characterized by six incompatible subtrends:
- A shortage of sellers
- A shortage of first-time buyers
- Looser credit standards for certain categories of buyers
- Fewer cash-only investors
- An increasingly hot market for high-end properties
- A decoupling of average new home prices from their long-run correlation with median household income
It's unclear at the moment what combination of these subtends will prevail. To understand what's going on, let's examine each subtrend in turn, starting with the shortage of sellers and existing homes for sale.
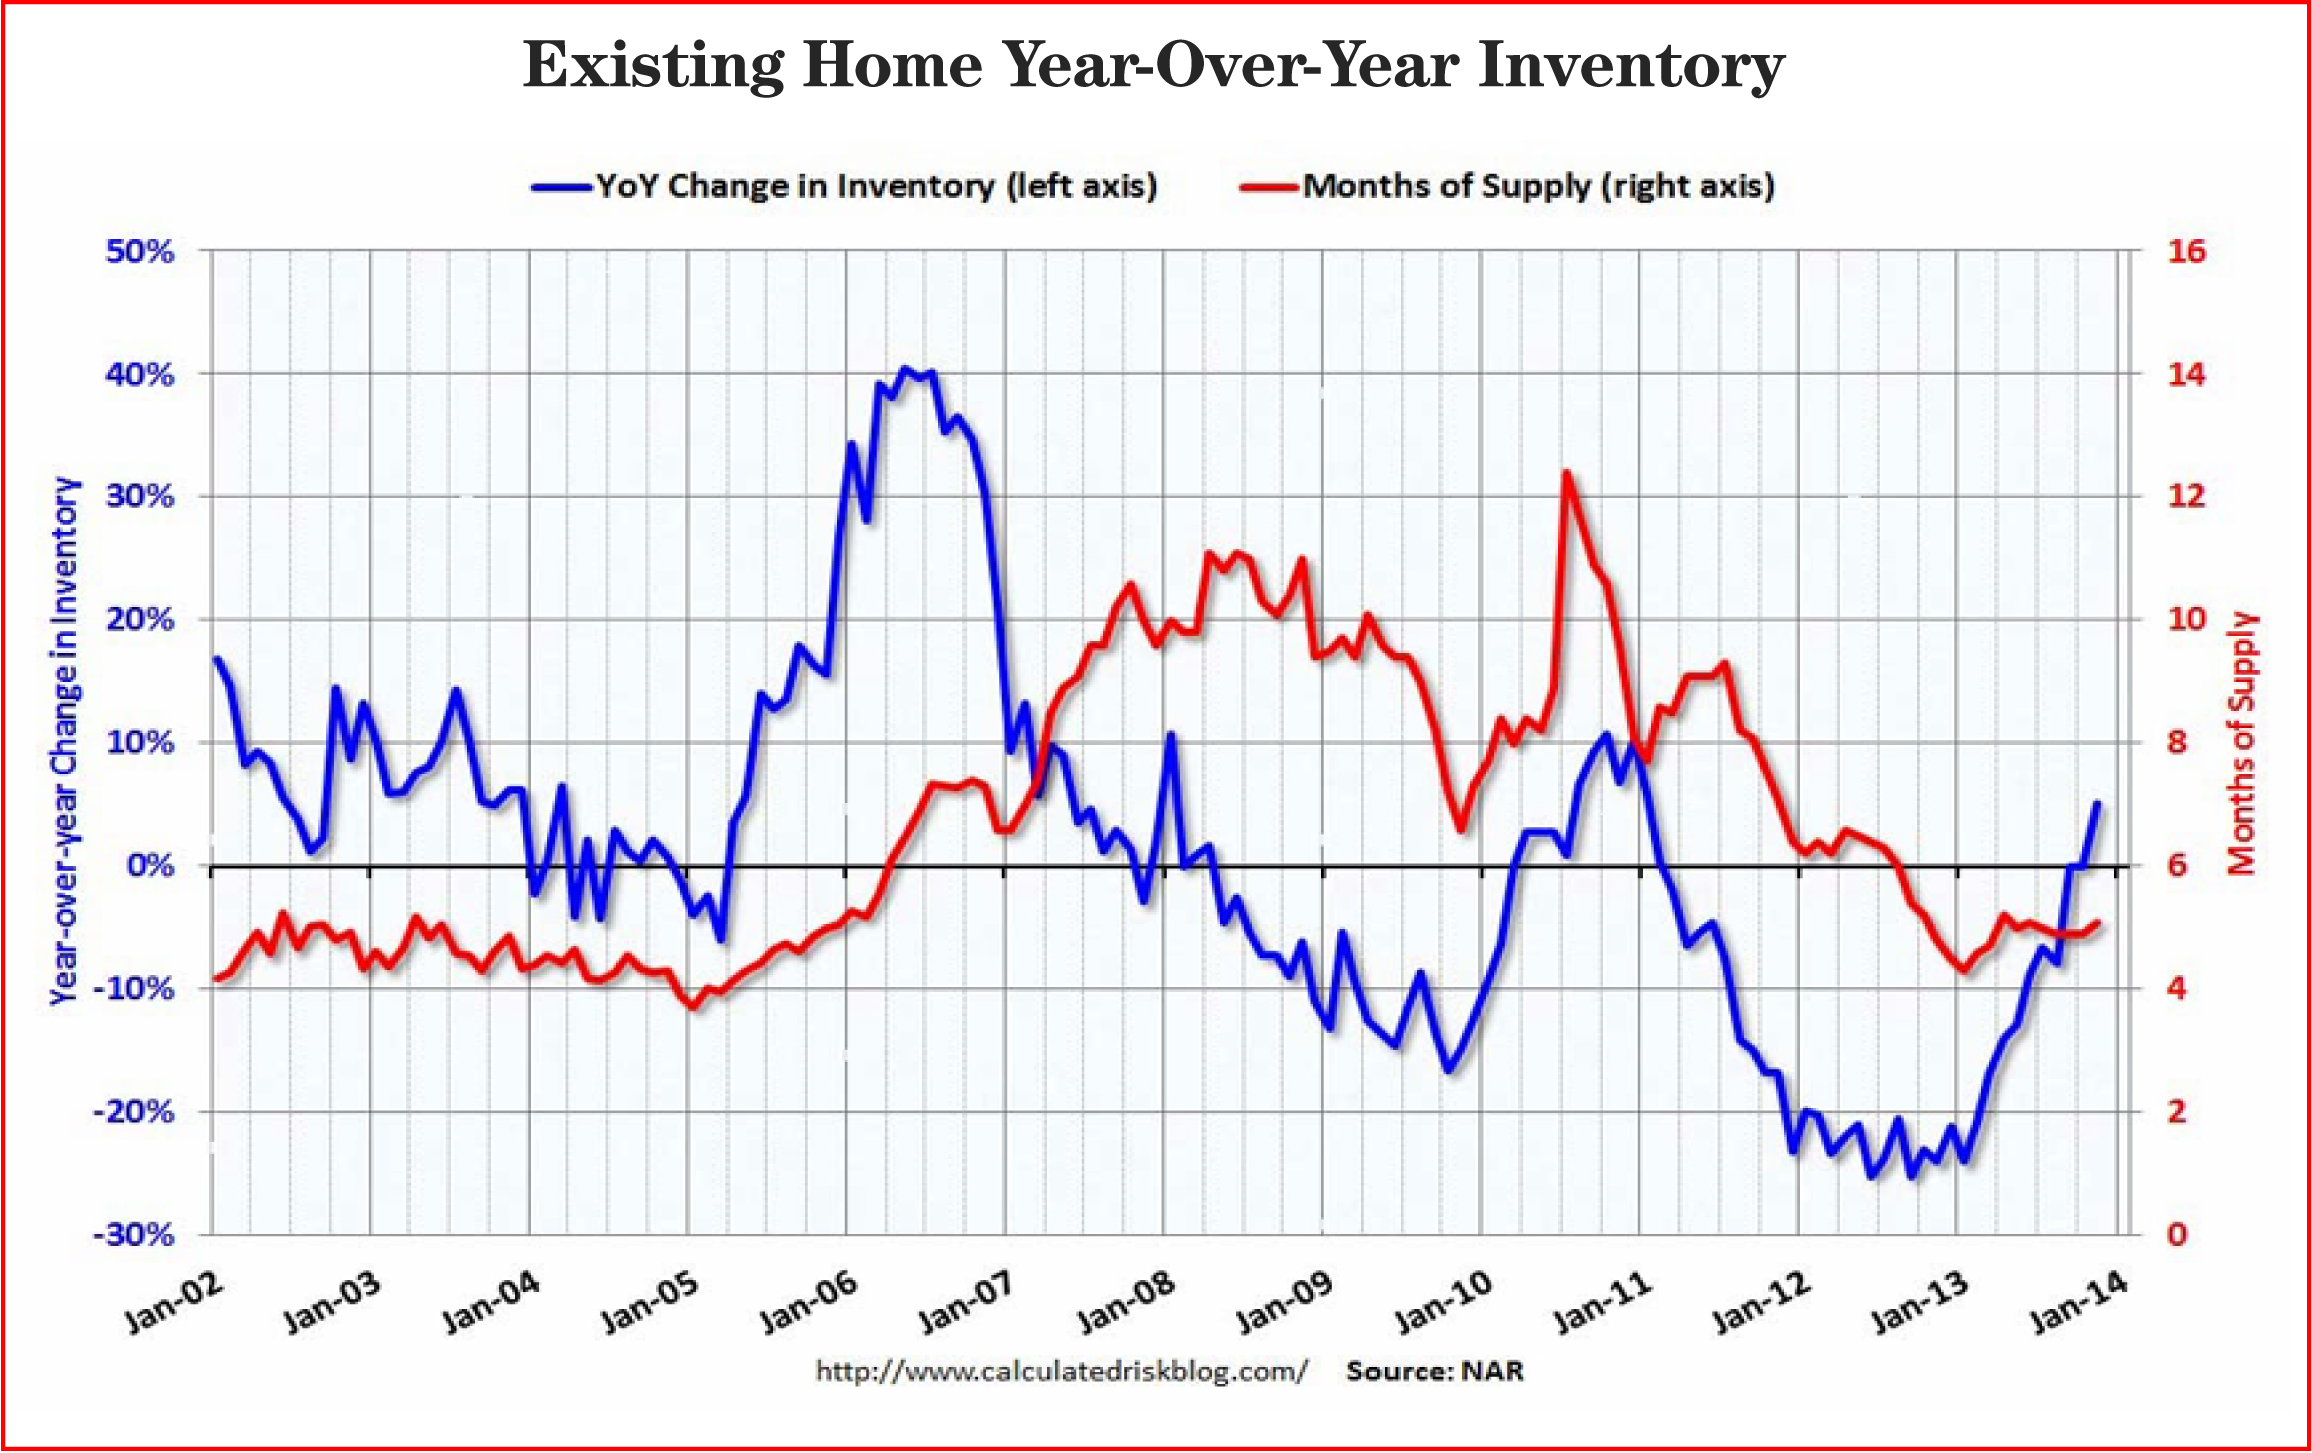
As of May 1, 2014, there was a very limited supply of homes from which potential buyers could choose. Specifically, there was a five-month inventory of homes on the market, compared with 5.9 months in 2012 and 8.3 months in 2011. The housing supply last dipped toward the five-month level at the height of the boom in 2006, when buyers snapped up homes faster than they could be added.
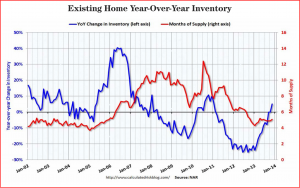
Existing Home: Year-Over-Year Inventory
This time, fewer homes are being listed because 19 percent of owners are underwater on their mortgages—meaning the sale price wouldn't be enough to repay their loan. Furthermore, the extreme winter that ended in early March prevented many in the Midwest and on the East Coast from listing their homes in recent months.
When few sellers emerged last year, prices for the limited number of homes available surged. Would-be buyers, facing a shortage of homes and locked in competition with one another, raised their offers. In a recent Associated Press story, the CEO of Redfin was quoted as saying that "60 percent of [our] buyers faced bidding wars in February, down from 73 percent at this time last year."
Prices climbed in locales such as San Francisco, where a ton of money is chasing few properties and there's not enough construction. On average, Bay Area homes have surged 23 percent over the past 12 months, according to the S&P Case-Shiller index. That was faster than any other major metro area except Las Vegas, where much of the housing stock was rebounding from the depths of the recession.
But while supply problems limit activity in the broader markets, the bottom of the market is plagued by a serious shortage of first-time buyers. This is the second subtrend influencing the U.S. housing market.
The demographic context discussed earlier in this issue is playing a major role. After the Great Recession officially ended in mid-2009, economists predicted that pent-up demand for homes would drive sales in the years to come.
Unfortunately, this demand has been slow to materialize, especially at the bottom. Therefore, the "domino effect"—which usually starts with 20-somethings buying so-called "starter homes" and often ends with retired professionals selling multimillion-dollar mansions—is not working as it should.
Five years into the recovery, buying remains subpar. Sales of existing homes are projected to total 5 million in 2014, according to the National Association of Realtors. That's roughly 100,000 fewer sales than 2013 and about 10 percent below the 5.5 million needed for a healthy housing market.
What happened to the first-time buyers? They bought about 1.5 million homes last year, about 500,000 fewer on average than should be expected given the number of young adults and the number of renters.
According to Trulia, the price increases we saw in 2013 made affordability a larger obstacle for potential first-timer buyers. Unlike current owners whose down payments come from selling a previous home, first-timers must amass a down payment. That means that higher home prices require more cash upfront.
Whether it's raising the down payment for a first-time purchase or a current homeowner qualifying for a mortgage on a new house, the recent loosening of lending standards represents the third major subtrend impacting the U.S. housing market.
After the economic meltdown began in 2008, people with middling-to-weak credit found it very difficult to qualify for mortgages. However, it's fair to argue that something resembling "subprime borrowing" has recently emerged.
Consider the facts. The median credit score for 30-year fixed mortgages had been around 730. Yet, according to the Associated Press, Wells Fargo is now offering mortgages to subprime borrowers with credit scores as low as 600, down from 640.
Similarly, non-bank lenders such as Carrington Mortgage Services are moving into that territory. Carrington has dropped its minimum credit score to 550. These examples indicate that lenders are becoming less tight-fisted after restricting credit in the wake of the financial crisis.
Why is this happening? Lenders are hungry for more business after mortgage refinancing plunged in the past year as interest rates rose. The average 30-year fixed mortgage rate has risen about a percentage point to 4.4 percent from near-historic lows in May. Meanwhile, a subprime borrower with a credit score of 550 would pay 7.15 percent, according to Carrington's rate sheet.
The fourth subtrend is the disappearance of cash-only investors. The Strategic Wealth Advisors editors have repeatedly called attention to the huge opportunity for those who invested in buy-to-rent homes that emerged beginning in 2010. According to the National Association of Realtors, in 2013, 20 percent of home sales were made to investors rather than traditional homeowners.
Most of these investors made all-cash offers and ignited bidding wars that other would-be homeowners lost. Typically, investors bought properties as rehab projects or rentals.
Areas that suffered the most during the recession's housing bust, including Phoenix, Las Vegas, and Tampa, have been the favorites of investors and have seen prices rise most strongly in percentage terms.
As a result, they're no longer the bargains that investors found them to be in 2010, 2011, 2012, and 2013. The result is that bidding wars aren't likely to be as fierce in 2014.
The fifth subtrend is the relative popularity of high-end properties vs. middle and low-end homes. For the moment, it's clearly better for sellers at the luxury end of the real-estate spectrum. Prices have generally been rising faster than at the lower end, and buying activity has continued to increase over the past year.
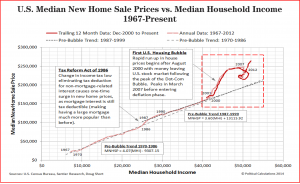
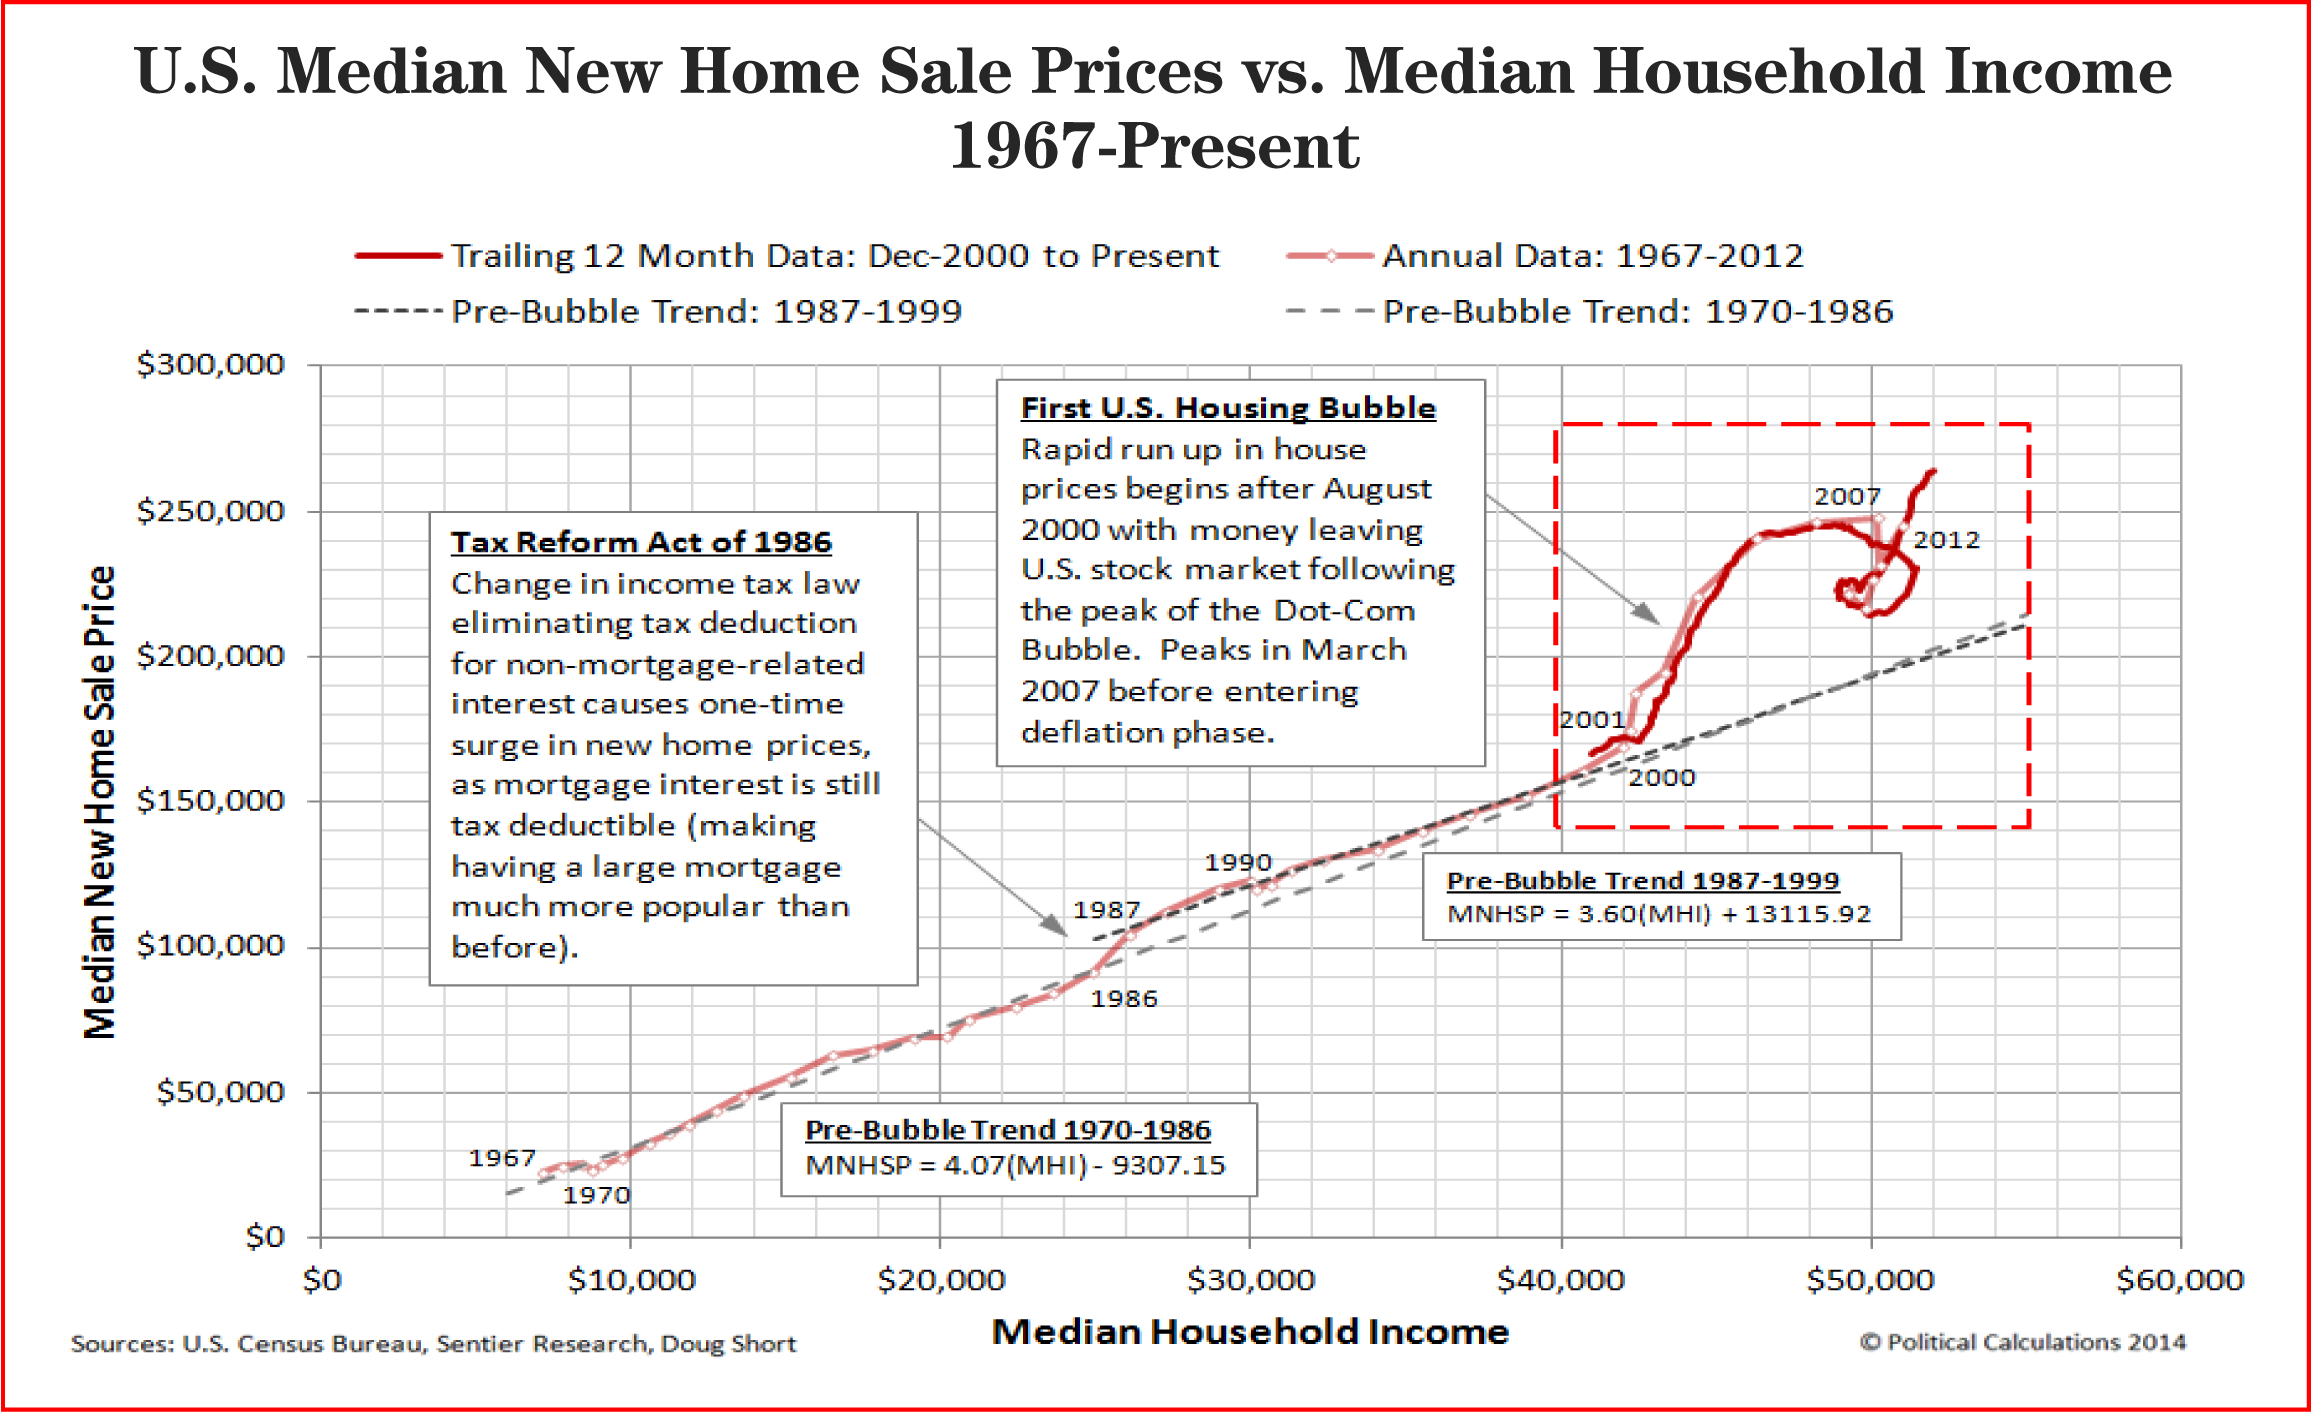
U.S. Medium New Home Sales Prices vs Medium Household Income
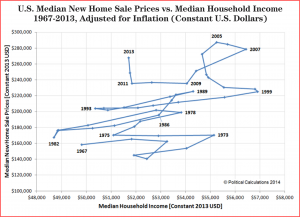
U.S. Median New Home Sale Prices vs. Median Household Income
Sales of homes worth more than $1 million rose 14.4 percent over the past 12 months, according to Bank of America Merrill Lynch. By contrast, sales of properties valued at less than $100,000 dropped 18 percent. A key reason: Fewer foreclosed homes are being listed.
According to Zillow, prices for more expensive homes have also risen much faster. The firm divided the U.S. housing stock into thirds based on price. The top one-third of the market, now valued at $305,700 or more, rose in value annually at a 3.38 percent average during the past 18 months. That price growth was 20 percent faster than the price rise seen by the bottom two-thirds of the market.
Essentially, it's a two-tiered market: Top-tier homeowners are enjoying a substantially better market than are the owners of bottom-tier homes.
That brings us to our sixth subtrend, the decoupling of personal incomes from housing prices.
Some have argued that the rapid rise in home prices during the housing bubble was the result of this decoupling. More important, they contend that the inflation of the housing bubble of 2001 to 2005 is now repeating. The message from those quarters is that we need to be ready for another housing crisis in the decade ahead.
Given these six subtrends driving the housing market, the editors of Strategic Wealth Advisor make the following forecasts for your consideration:
First, the shortage of homes for sale is likely to be reduced in 2014 and 2015, as prices reach levels that sellers consider enticing.
As always, supply problems will correct themselves. Higher prices will lure more sellers into the market who see an opportunity to cash out. About 19 percent of homeowners owe more on their mortgages than their properties would sell for, according to the online real estate database Zillow. An additional 37 percent are "effectively underwater": Their sale profit would be too low to cover the cost of listing their home and putting a down payment on a new property. Still, each mortgage payment repairs some of the damage and improves a homeowner's equity. As home values grow further, more people will start to put their homes up for sale, and the supply should rise. That would lead to more listings and reduce bidding wars among buyers. Warmer weather, job growth, and a strengthening economy will also encourage more listings.
Second, we'll see a rise in first-time home buyers as the economy improves, but a major surge will not take place before 2017 or 2018.
The situation is slowly improving for the 25- to 34-year-olds who would buy homes. About 738,000 of them found jobs in the past year. With more disposable income, more of them will move out on their own. Homebuilders have already ramped up apartment construction in anticipation of younger renters. That's a critical first step before they eventually buy a house or condo. It will take years for these young adults to accumulate the savings and credit history needed to buy a home.
Third, lenders will continue to loosen standards in the medium term, but this will not lead to a catastrophic blow-up.
Loosening standards will permit many younger people to become homeowners and start the crucial domino effect that leads to a healthy economy. This time around, memories of the "housing crash" are fresh in the minds of lenders, borrowers, and regulators; these will prevent the worst excesses from repeating themselves. Moreover, as the Strategic Wealth Advisor editors have argued since the fall of 2008, the difference between the moderate 1991 recession and the existential crisis of 2008 to 2009 was primarily the result of mark-to-market accounting rules that no longer apply.
Fourth, investors will continue to buy rental properties, but their 20 percent share of total transaction value in 2013 represented a peak.
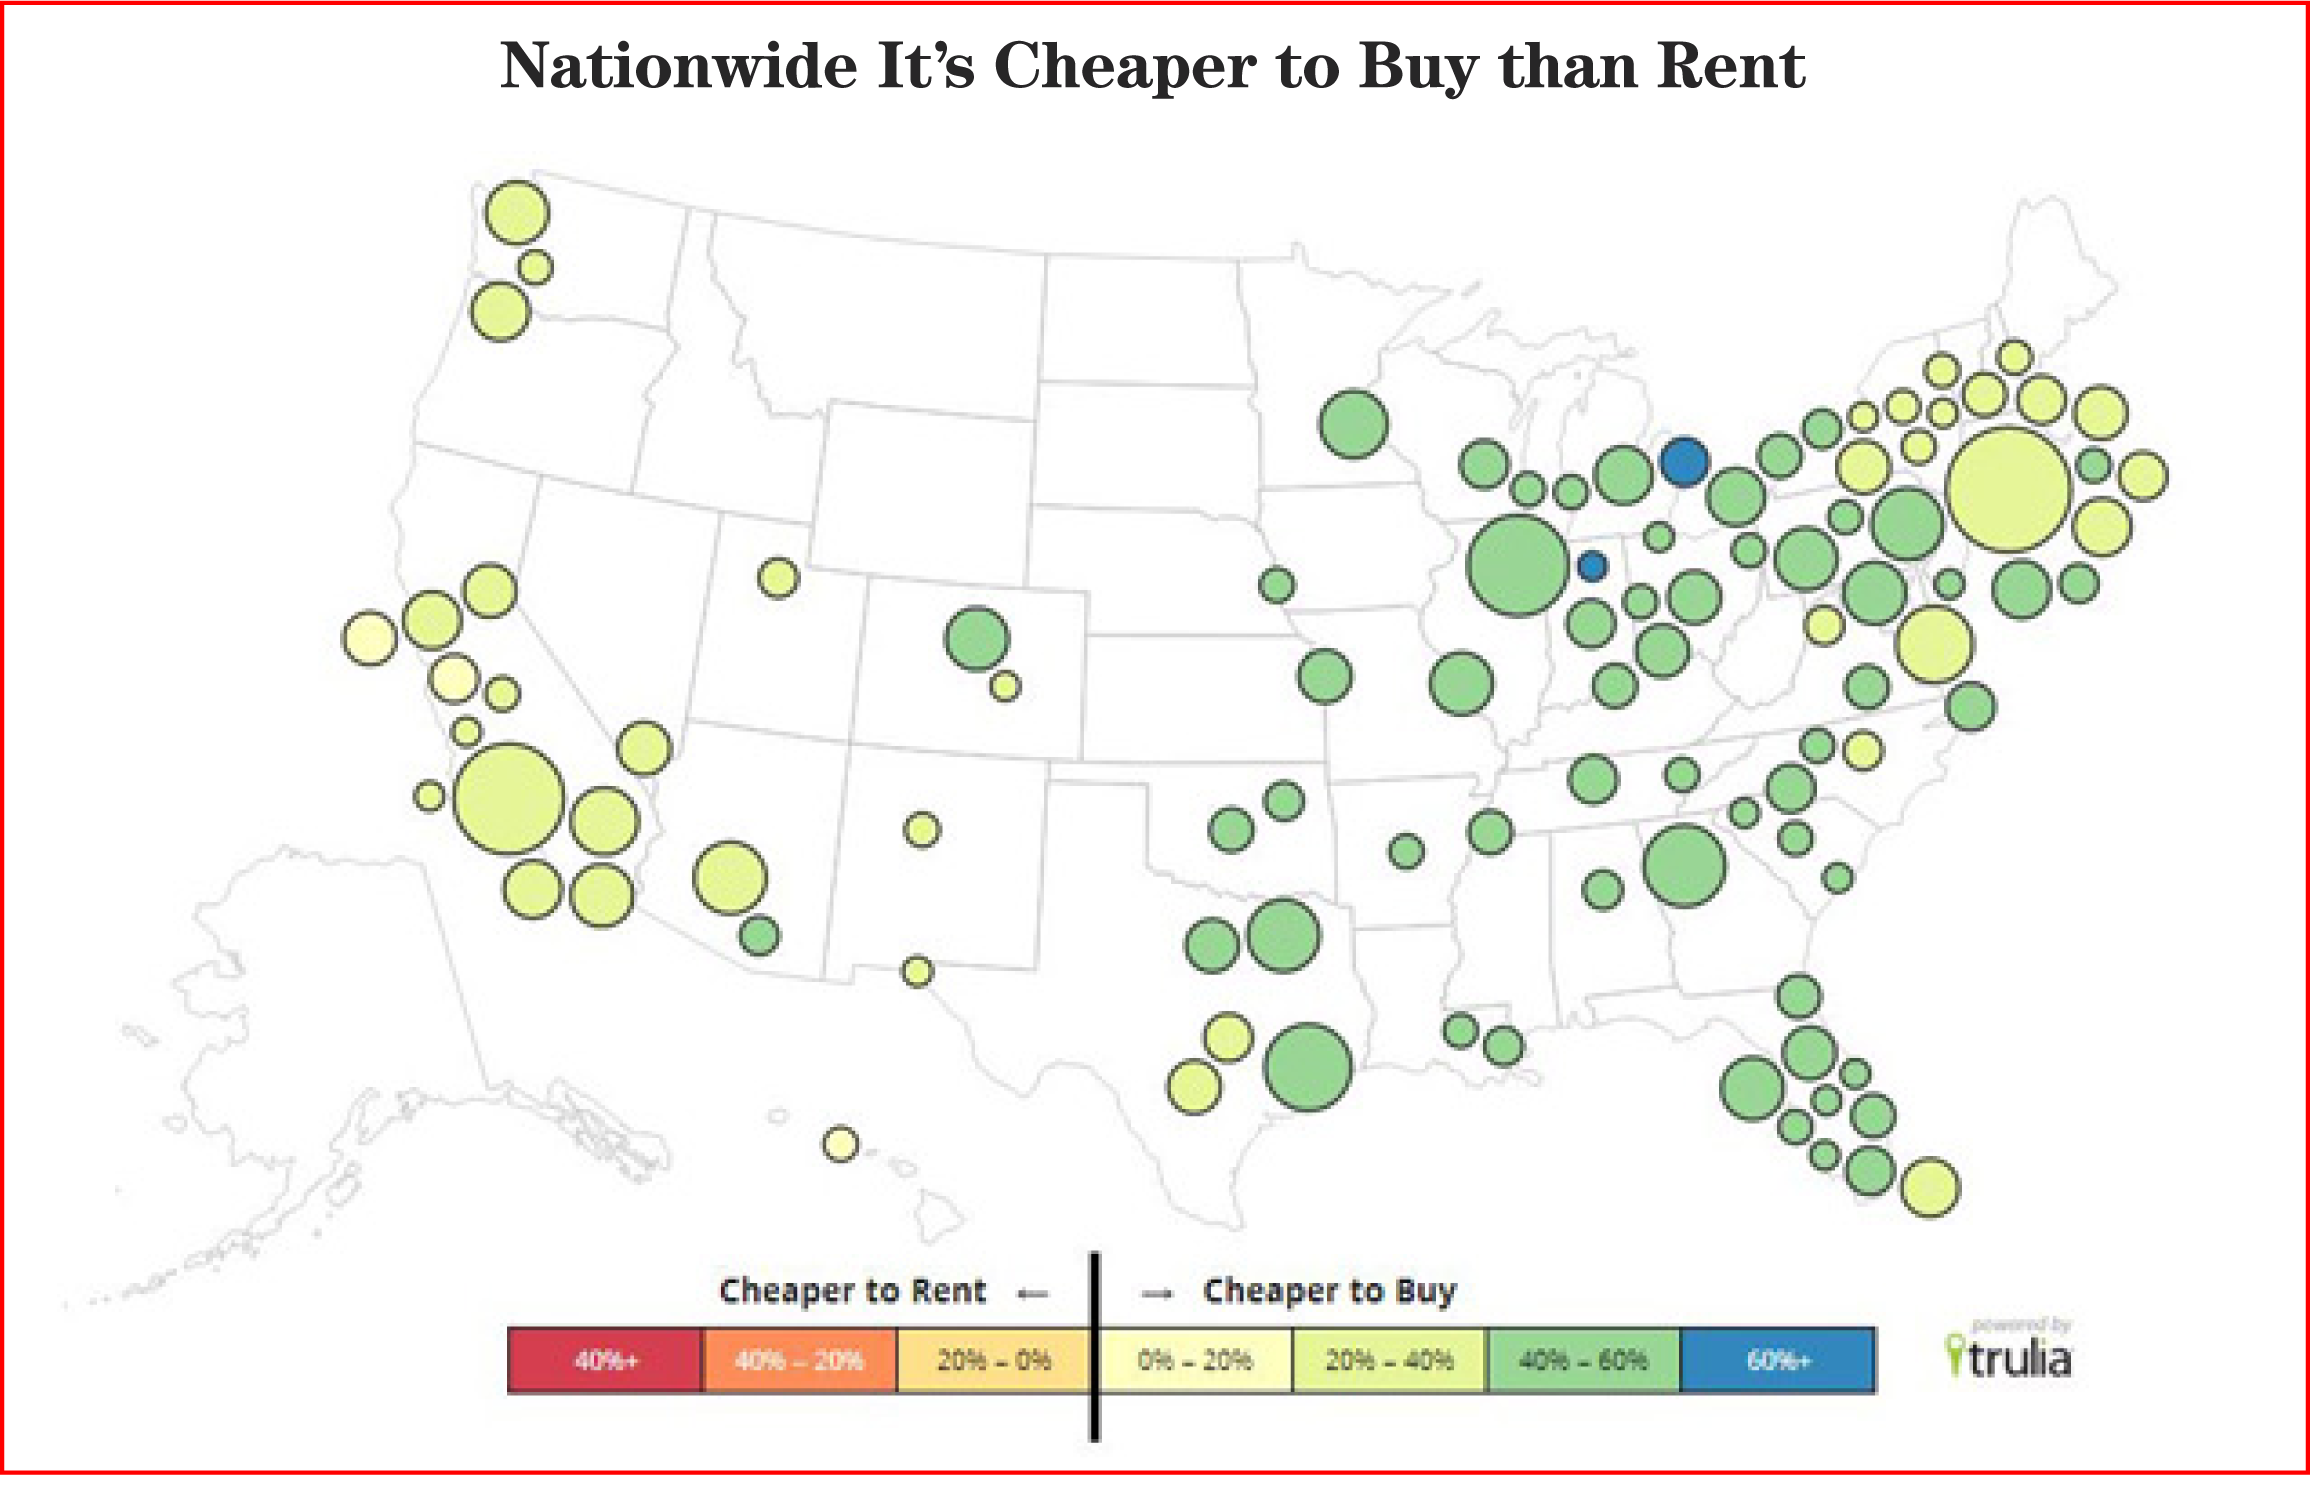
As the result of surging rents, Trulia now reports that there is no major U.S. market where it's cheaper to rent than to own. However, would-be first-time buyers, saddled with student loan debt and a precarious employment situation, are either unwilling or unable to buy. This means a steadily growing rental market waiting to be exploited by shrewd investors. That dynamic is on display in places like Cincinnati, where home prices only rose an average of 2 percent in 2013, while rental rates jumped 10 percent. With bond yields expected to remain low, investors have a choice between rental property and equities; for those seeking income as much or more than capital gains, the rental property option will continue to be attractive for at least another three to five years.
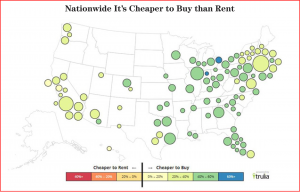
Nation Wide Cheaper to Rent
Fifth, the market for high-end homes will continue to be stronger than the market for low-end homes, for at least the next five years.
As we have previously detailed, wealth currently belongs to the Boomers, the Silent Generation, and the remaining members of the Greatest Generation. Fed policy and tax policy have been tuned to maximize after-tax investment income, rather than employment income. Since people with wealth are most likely to buy expensive homes, those are the homes that will sell. Even when affluent retirees "downsize," they frequently buy expensive condominiums or cottages in exotic locations. Fortunately, as the Deployment phase of the Digital Revolution and the accompanying North American Energy Revolution kicks in, broad-based economic gains will reenergize housing across the spectrum. We're already seeing this in places like North Dakota and Texas.
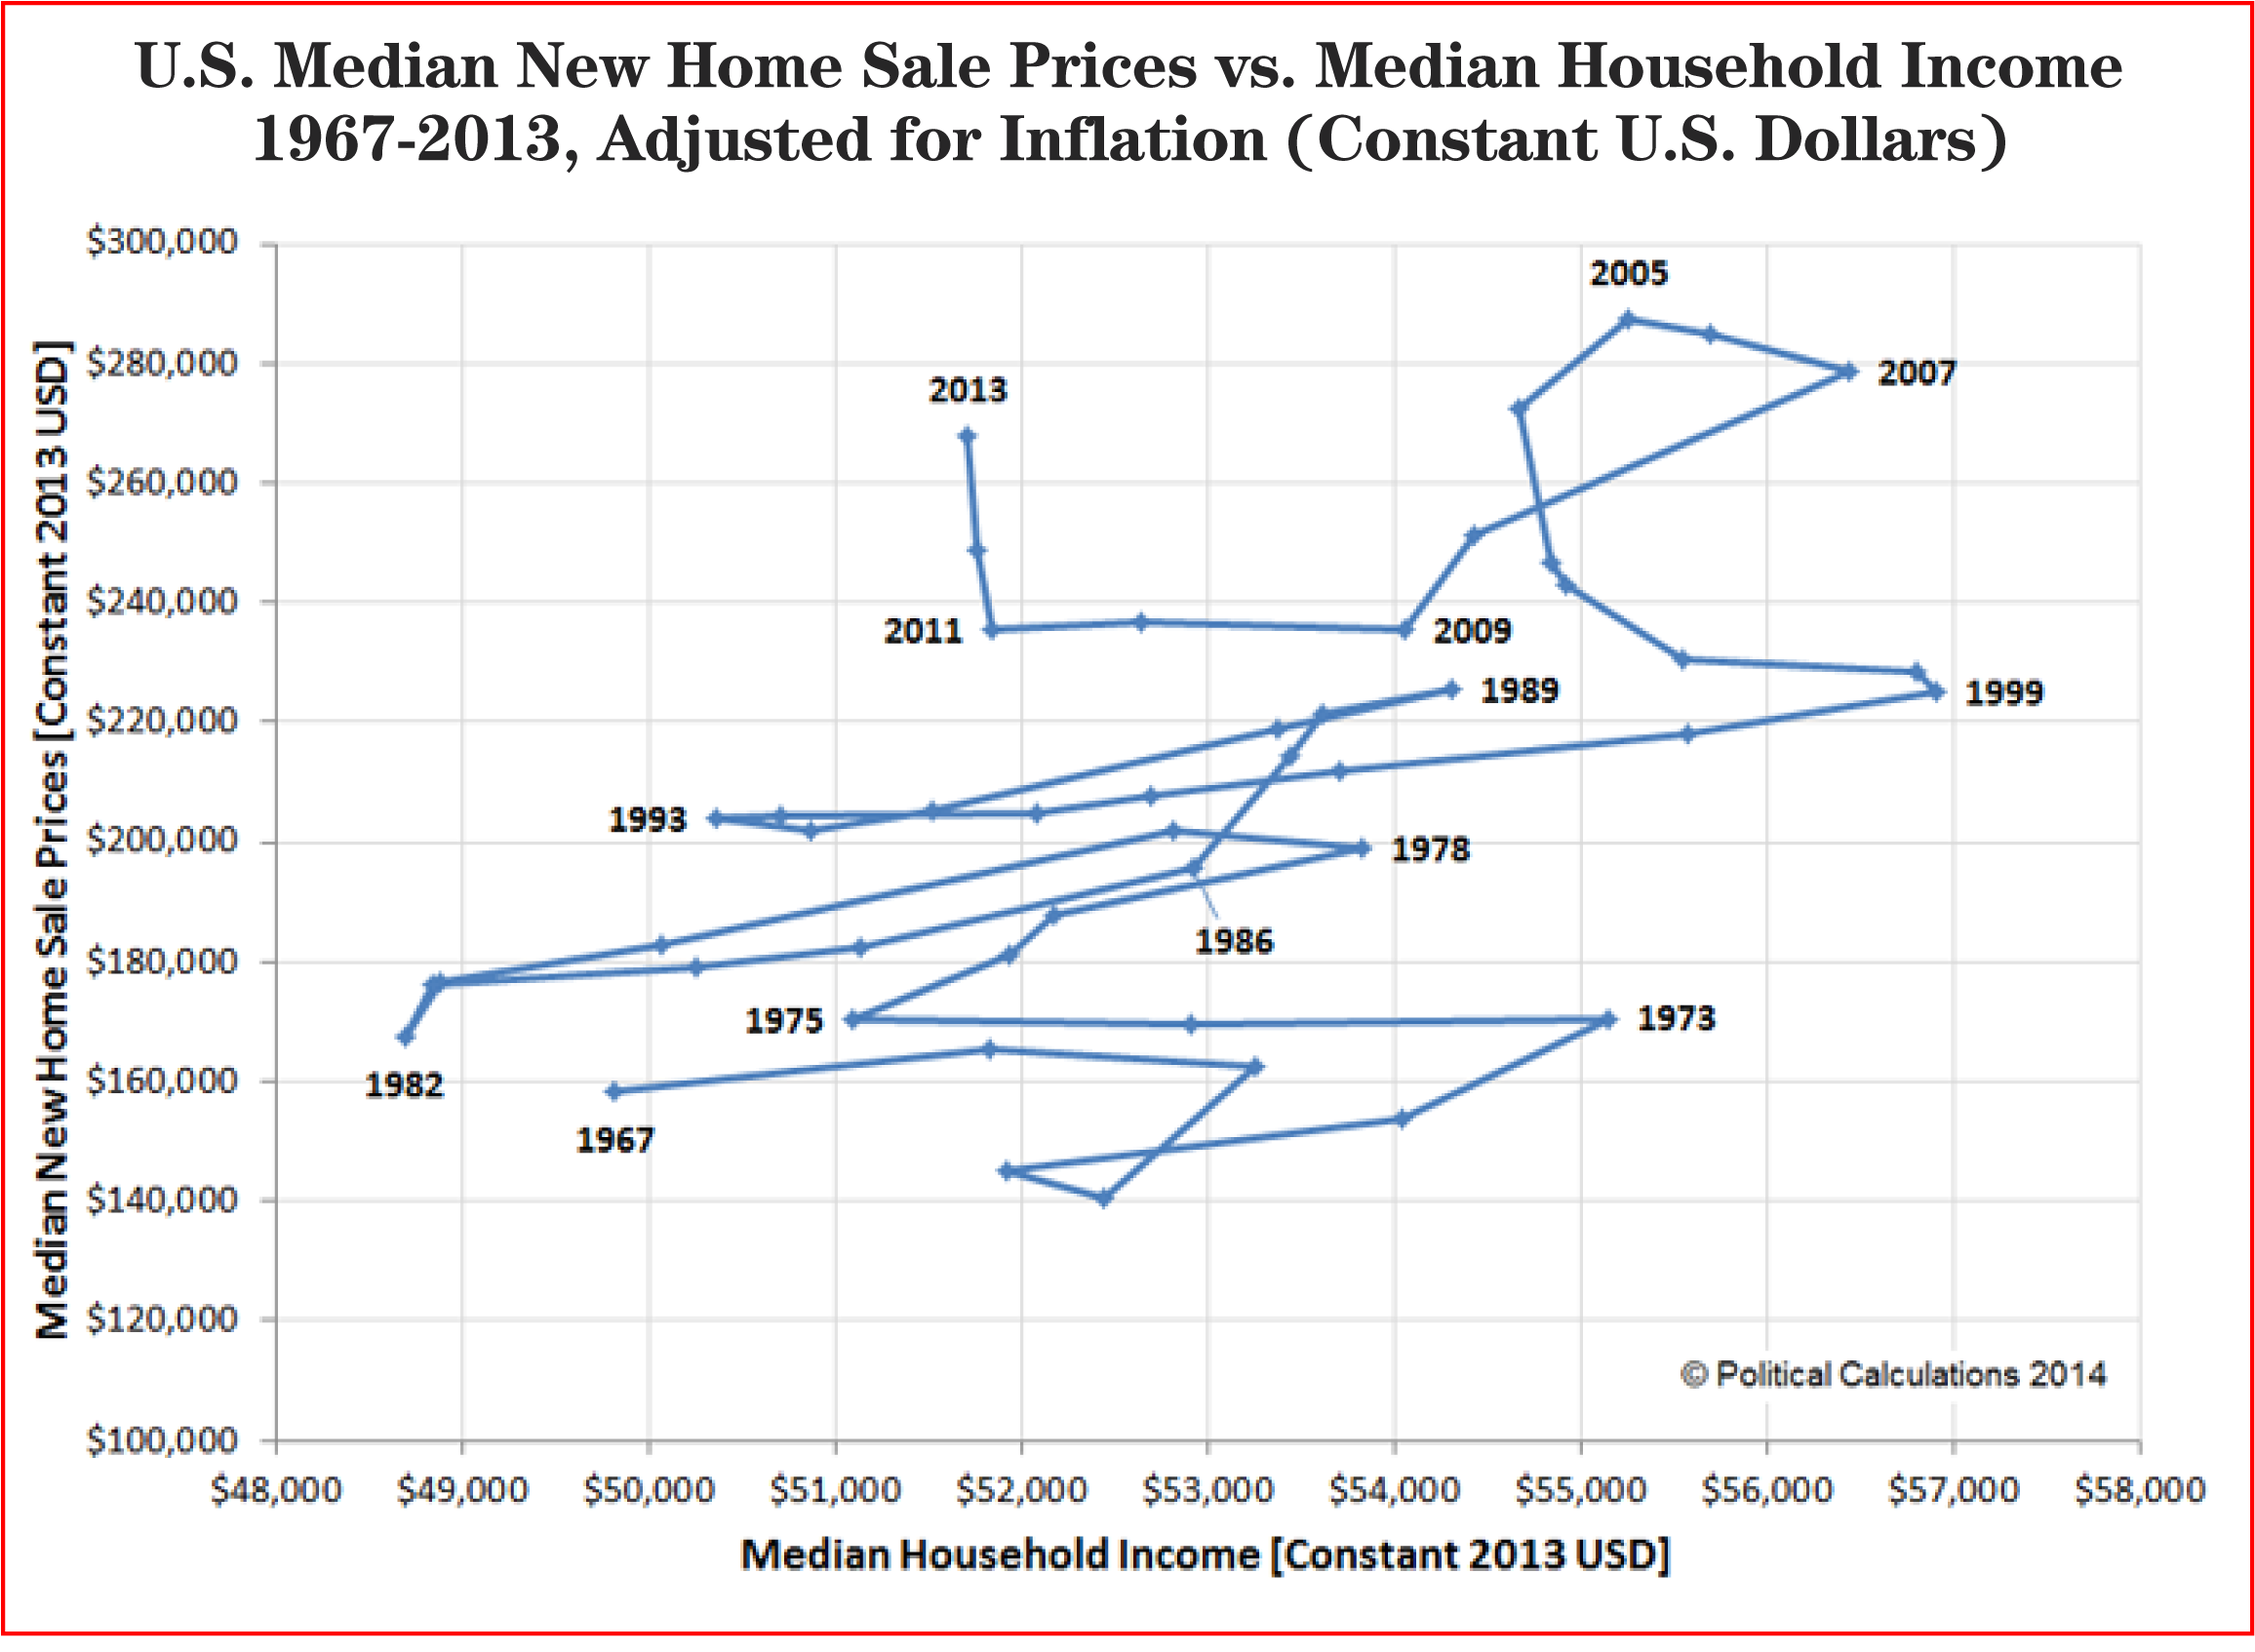
Sixth, the apparent decoupling between median household incomes and median new home prices is nothing to be concerned about.
When one looks at nominal incomes and new home prices over the past 46 years, there's an excellent linear relationship between them from 1967 to 2000, at which point that relationship appears to break down, as prices soar. However, when real inflation-adjusted prices and incomes are used, that apparent correlation is shown to be a mathematical fiction. On the contrary, real home prices have risen primarily as a function of larger home size. Meanwhile, real median household income has fluctuated as a function of short-term economic fluctuations, coupled with the changed composition of the median household. So, the Strategic Wealth Advisor editors believe that this is simply "much ado about nothing."
Did you find this valueable? Share on:
 If you had a nickel for every executive who appeared on CNBC and blamed his or her company's inability to grow on a weakness in the market, you'd be richer than Croesus.
 Are You Ready for the Greatest Retirement Crisis in American History?